The ability to visualize data is essential for Salesforce developers looking to create meaningful insights and communicate information effectively. Interactive charts and graphs play a crucial role in this process, allowing users to explore data, identify trends, and make informed decisions. In this blog post, we will explore the world of building interactive charts and graphs with LWC, and dive into the various techniques and best practices to dynamic visualizations that will delight your users.
Understanding the Power of Interactive Charts and Graphs
Before we delve into the technical aspects of building interactive charts and graphs, let’s take a moment to understand the power and impact they have in data analysis. Interactive visualizations enable users to engage with data in a more intuitive and immersive way, providing real-time feedback and allowing for seamless exploration.
By leveraging interactivity, developers can help users drill down into specific data points, apply filters, and customize their views to gain deeper insights. This level of interaction goes beyond static charts and empowers users to discover patterns, outliers, and correlations that might otherwise remain hidden. With the ability to interact with visualizations, users can uncover actionable intelligence and drive data-driven decision-making.
Getting Started with Lightning Web Components (LWC)
To build interactive charts and graphs in Salesforce, we need to familiarize ourselves with Lightning Web Components (LWC). LWC is a modern, lightweight framework for building applications in Salesforce. It provides a robust and efficient way to create user interfaces that are highly interactive and responsive.
With LWC, developers can leverage its powerful features such as data binding, life cycle hooks, and event handling to create dynamic visualizations. LWC also brings in the benefit of reusability and encapsulation, allowing us to build modular and maintainable components.
Choosing the Right Charting Library
Now that we have a solid foundation in LWC, let’s explore the various charting libraries available to us. Choosing the right charting library is crucial as it determines the capabilities and customization options we have for our interactive visualizations.
One popular charting library is Chart.js. It is a versatile and feature-rich library that supports a wide range of chart types, from basic line and bar charts to complex radar and bubble charts. Chart.js also provides robust options for customization and interaction, making it a great choice for building interactive charts and graphs in LWC.
Another notable charting library is D3.js. D3.js is a powerful and flexible library that allows for precise control and customization of visualizations. It provides a rich set of data-driven transformations, animations, and layouts that enable developers to create highly customized and dynamic charts and graphs.
When selecting a charting library, consider factors such as ease of integration with LWC, documentation and community support, performance, and customization options. Take your time to explore and experiment with different libraries to find the one that best fits your requirements.
Integrating Chart.js with Lightning Web Components
In this section, we will focus on integrating Chart.js with LWC to create interactive charts and graphs. Chart.js provides a simple and intuitive API that allows us to build visualizations with minimal code.
To get started, we need to include the Chart.js library in our LWC project. We can either download the library files and host them locally or leverage a content delivery network (CDN) to load them dynamically. Once we have Chart.js available, we can start creating our interactive charts and graphs.
One common use case is to display data in a bar chart format. Let’s walk through the steps to create a basic bar chart using Chart.js in LWC:
- Import the necessary Chart.js modules in your LWC component:
import { LightningElement, api, wire } from 'lwc';
import { loadScript } from 'lightning/platformResourceLoader';
import { ShowToastEvent } from 'lightning/platformShowToastEvent';
import chartjs from '@salesforce/resourceUrl/chartjs';
import { createChart } from 'chart.js';
- Load Chart.js using the
loadScriptfunction in the renderedCallback:
renderedCallback() {
    Promise.all([
        loadScript(this, chartjs + '/Chart.min.js')
    ]).then(() => {
        // Chart.js loaded successfully
    }).catch(error => {
        // Error loading Chart.js
        this.dispatchEvent(
            new ShowToastEvent({
                title: 'Error',
                message: 'An error occurred while loading Chart.js',
                variant: 'error'
            })
        );
    });
}
- Create a canvas element in the HTML template to render the chart:
<template>
    <div class="chart-container">
        <canvas class="bar-chart"></canvas>
    </div>
</template>
- Initialize and populate the chart data in the JavaScript controller:
const data = {
    labels: ['January', 'February', 'March'],
    datasets: [
        {
            label: 'Sales',
            backgroundColor: 'rgba(54, 162, 235, 0.5)',
            borderColor: 'rgb(54, 162, 235)',
            borderWidth: 1,
            data: [100, 200, 150]
        }
    ]
};
const config = {
    type: 'bar',
    data: data,
    options: {
        responsive: true,
        scales: {
            y: {
                beginAtZero: true
            }
        }
    }
};
const chartElement = this.template.querySelector('.bar-chart');
const chart = createChart(chartElement, config);
- Style the chart container and canvas in the CSS file:
.chart-container {
    position: relative;
    height: 300px;
    width: 400px;
}
.bar-chart {
    height: 100%;
    width: 100%;
}
By following these steps, we have successfully integrated Chart.js with LWC and created a basic bar chart. We can further enhance this chart by adding interactivity, tooltips, axis labels, and other customizations supported by Chart.js. Experiment with different chart types and configurations to create compelling visualizations that cater to your users’ needs.
Leveraging D3.js for Advanced Visualizations
While Chart.js provides an excellent starting point for building interactive charts and graphs, there are cases where we require more advanced customizations and complex visualizations. This is where D3.js comes into play.
D3.js stands for Data-Driven Documents and is a JavaScript library that allows us to bind data to the Document Object Model (DOM) and create dynamic, data-driven visualizations. With D3.js, we have fine-grained control over every aspect of our charts and graphs, from data manipulation and layout to visual encoding and interaction.
To harness the power of D3.js in our LWC components, we can follow these steps:
- Import the D3.js library in your LWC component:
import { LightningElement, api, wire } from 'lwc';
import { loadScript } from 'lightning/platformResourceLoader';
import { ShowToastEvent } from 'lightning/platformShowToastEvent';
import d3 from '@salesforce/resourceUrl/d3';
- Load D3.js using the
loadScriptfunction in the renderedCallback:
renderedCallback() {
    Promise.all([
        loadScript(this, d3 + '/d3.min.js')
    ]).then(() => {
        // D3.js loaded successfully
    }).catch(error => {
        // Error loading D3.js
        this.dispatchEvent(
            new ShowToastEvent({
                title: 'Error',
                message: 'An error occurred while loading D3.js',
                variant: 'error'
            })
        );
    });
}
- Use D3.js to create interactive visualizations in the JavaScript controller:
constructor() {
    super();
    this.svgWidth = 500;
    this.svgHeight = 300;
}

createChart() {
    const svg = d3.select('.chart-container')
        .append('svg')
        .attr('width', this.svgWidth)
        .attr('height', this.svgHeight);

    // More D3.js code here
}
With D3.js, the possibilities are virtually endless. We can create intricate visualizations such as network graphs, force layouts, and geographic maps. D3.js allows us to manipulate every element, shape, and interaction, giving us full control over the final result. However, it’s important to note that the learning curve for D3.js can be steep, and significant time and effort are required to master its advanced capabilities.
Enhancing Interactivity with User-Friendly Controls
While interactive charts and graphs are powerful tools on their own, integrating user-friendly controls can take the user experience to the next level. By providing intuitive controls, users can manipulate data, adjust parameters, and explore different aspects of the visualization effortlessly.
One common control element used with interactive charts and graphs is a range slider. A range slider allows users to select a specific range or filter data based on certain criteria. Let’s see how we can integrate a range slider with interactive charts using LWC and the Lightning Design System (SLDS):
- Import the necessary SLDS components in your LWC component:
import { LightningElement, api } from 'lwc';
- Include the range slider markup in the HTML template:
<template>
    <div class="slds-form-element">
        <div class="slds-form-element__control">
            <input type="range" min="0" max="100" value="0" step="1" class="slds-input" />
        </div>
    </div>
</template>
- Add event listeners for the range slider in the JavaScript controller:
handleRangeChange(event) {
    const rangeValue = event.target.value;
    // Update chart based on range value
}

connectedCallback() {
    const rangeSlider = this.template.querySelector('.slds-input');
    rangeSlider.addEventListener('input', this.handleRangeChange.bind(this));
}
By incorporating user-friendly controls like range sliders, we enable users to interact with our charts and graphs more intuitively. Consider other types of controls such as checkboxes, dropdown menus, and toggle switches to enhance the interactivity of your visualizations further.
Best Practices for Building Interactive Charts and Graphs
Now that we have explored the technical aspects of building interactive charts and graphs with LWC, let’s review some best practices to ensure our visualizations are effective and engaging:
- Keep it Simple: Avoid cluttering your charts with unnecessary elements. Focus on presenting the most relevant information and remove any distractions.
- Provide Context: Add axis labels, legends, and tooltips to provide context and help users understand the data presented in the chart.
- Use Color Meaningfully: Choose colors that convey meaning and facilitate easy interpretation. Avoid using excessive colors that might confuse or distract users.
- Optimize Performance: Visualizations with large datasets or complex interactions can be resource-intensive. Optimize your code, use pagination or virtualization techniques, and consider data aggregation to improve performance.
- Test with Real Users: Solicit feedback from real users to understand their needs and pain points. Iterate on your visualizations based on this feedback to provide the best user experience.
By following these best practices, you can create interactive charts and graphs that not only provide valuable insights but also engage and captivate your users.
Conclusion
In this blog post, we have explored the world of building interactive charts and graphs with LWC. We started by understanding the power and impact of interactive visualizations and then delved into the technical aspects of integrating Chart.js and D3.js with LWC.
We learned how to create basic bar charts using Chart.js and advanced visualizations using D3.js. We also explored the importance of user-friendly controls and best practices for building effective and engaging interactive charts and graphs.
As Salesforce developers, the ability to build interactive visualizations is a valuable skill that can enhance the user experience and drive data-driven decision-making. With LWC and the wide range of charting libraries available, the possibilities are limitless. So go ahead, experiment, and create interactive charts and graphs that will leave your users amazed!

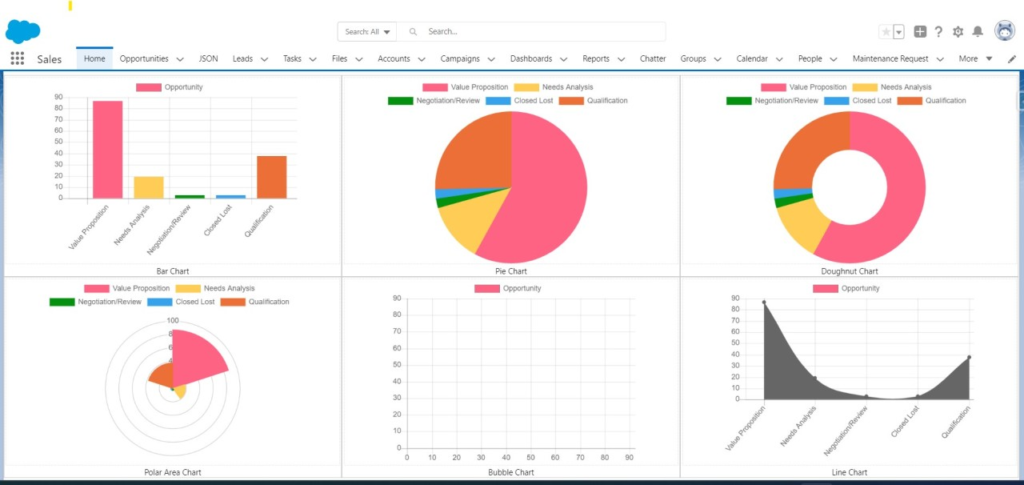
Wow, this is a good example for using third part libraries in lwc. Can you please provide the code you used to achieve the different reports on Opportunity in the first image please.